
Highlights
Macroeconomic factors
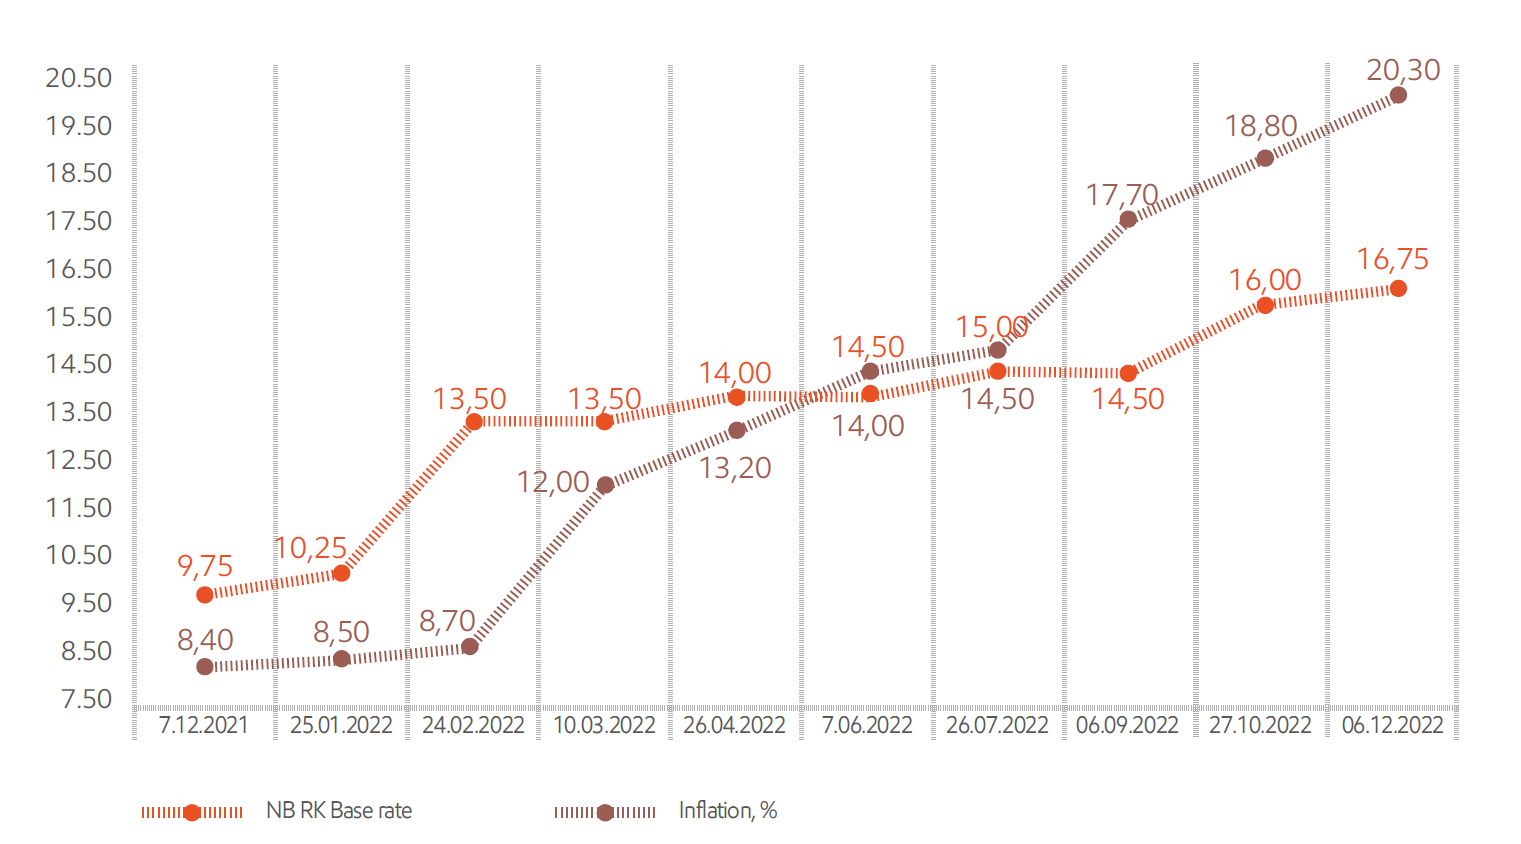
Based on Halyk Finance think tank data, in 2022, Kazakhstan's economy experienced the same challenges as the global economy with record consumer inflation, tighter monetary conditions (MCs), and reduced consumption. The negative impact of the January state of emergency across the country, as well as the war in Ukraine, affected Kazakhstan's economy and its main trading partners. They triggered disruptions in the established supply logistics, which indirectly contributed to an acceleration in consumer inflation. In 2022, inflation was the highest since 1996. It amounted to 20.3%, which in turn triggered significant price increases.
State budget expenditure in 2022 has increased by 20%. There was also a 4.3% drawdown in economic growth due to lower oil production because of maintenance work on the country's three biggest oil fields. In autumn, OPEC+ countries decided to limit oil production, which also affected Kazakhstan's quota. Fiscal stimulus, external demand and high hydrocarbon prices, as well as a record grain harvest, kept the Kazakh economy from a greater slowdown. In 2022, the economy of Kazakhstan showed a total growth of 3.2%. Together with extrabudgetary funds, the fiscal impulse has put significant pro-inflationary pressure on the economy of Kazakhstan.
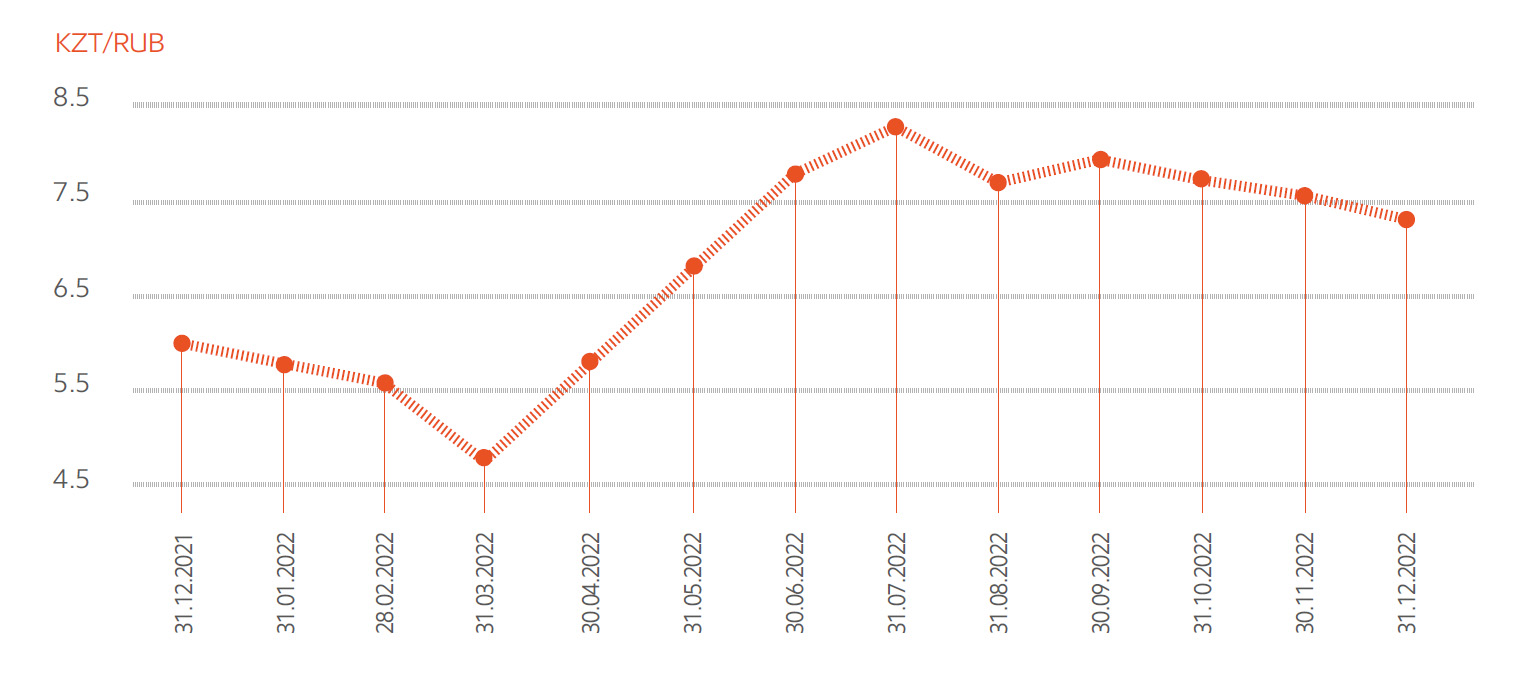
The negative external background in 2022 has also had an impact on the depreciation of the national currency by 8.1% against the US dollar. The tenge also depreciated against the Russian rouble by 20%. Given the prevailing volume of imports from Russia, it led to a further increase in the inflationary pressure on the economy. In view of the high inflation rate and continuing pro-inflation risks, the National Bank of Kazakhstan raised the base rate first to 16.0% and then to 16.75%. It also expressed the need to maintain the base rate at the current level for an extended period.
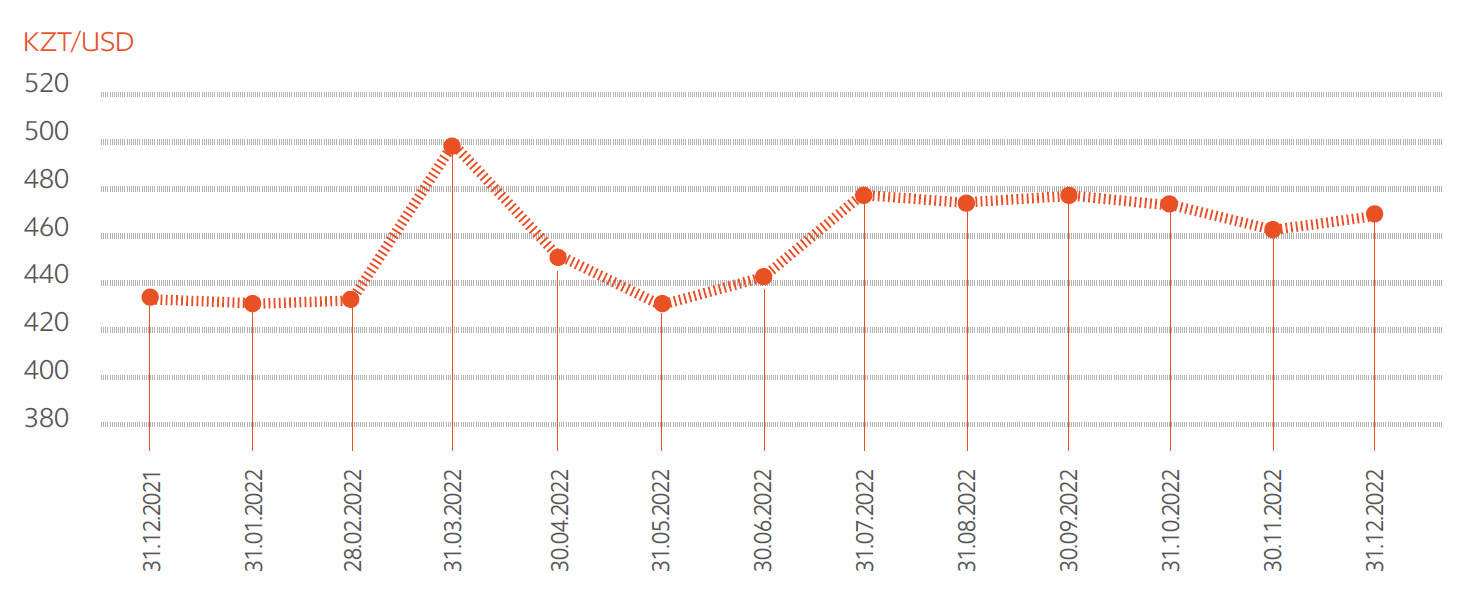
At the end of 2022, the exchange rate fluctuated from 431.67 KZT/USD to 462.65 KZT/USD (a weakening of ~7%), with a fluctuation of 512 KZT/USD during the year.
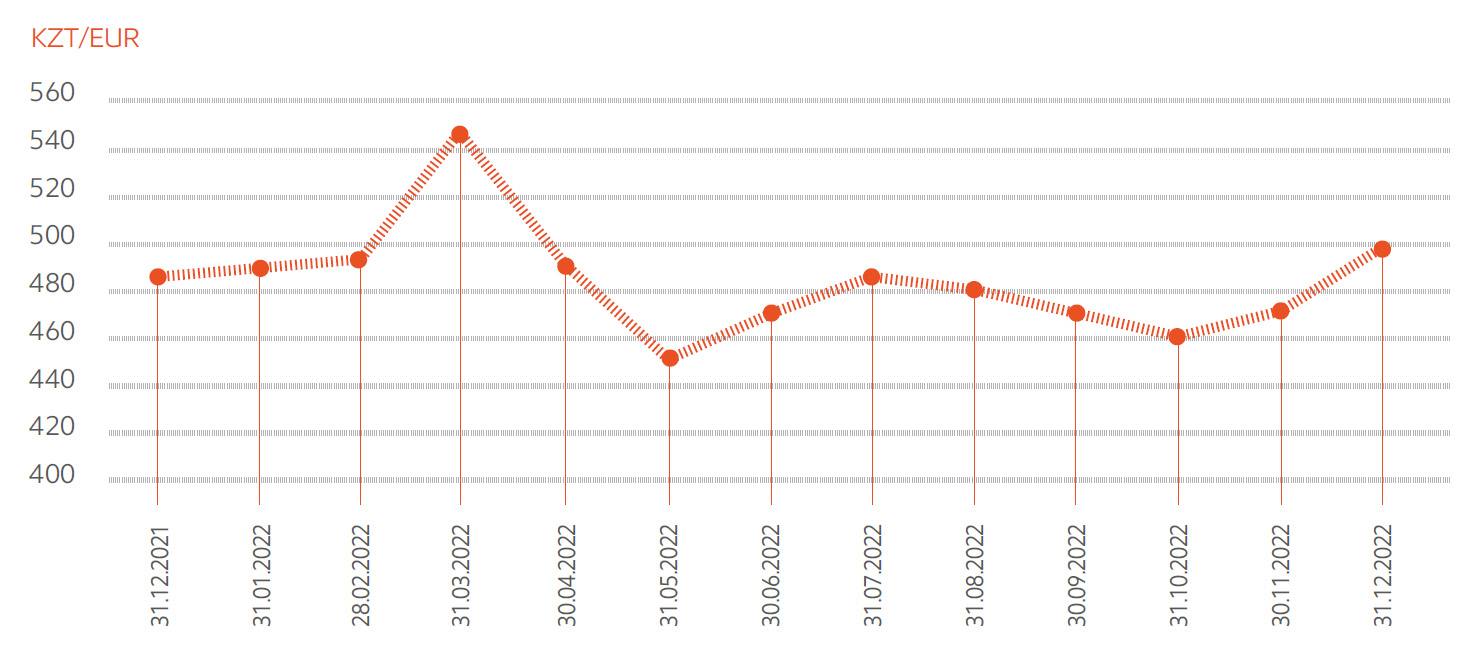
EXCHANGE RATE DYNAMICS
| 31.12.2021 | 31.12.2022 | % | |
|---|---|---|---|
| KZT/USD | 431.67 | 462.65 | 107% |
| KZT/EUR | 487.79 | 492.86 | 101% |
| KZT/RUB | 5.77 | 6.43 | 111% |
Financial and economic results
KEY FINANCIAL AND ECONOMIC INDICATORS, KZT MILLION
| Indicator12 | 2020 actual | 2021 actual | 2022 actual | 2023 forecast | 2024 forecast |
|---|---|---|---|---|---|
| Revenues from sale of products and services | 283,010 | 332,537 | 381,465 | 429,842 | 507,436 |
| Cost of products sold and services delivered | (225,185) | (254,847) | (288,929) | (345,454) | (384,733) |
| Gross profit | 57,826 | 77,690 | 92,536 | 84,387 | 122,703 |
| Operating profit | 31,798 | 53,868 | 64,574 | 57,501 | 96,994 |
| Earnings before interest, taxes, depreciation, and amortization (EBITDA) | 99,728 | 123,447 | 141,382 | 135,925 | 202,303 |
| Profit (loss) before tax | 13,739 | 24,055 | 47,153 | 45,799 | 92,076 |
| Total profit (loss) before minority interest | 8,083 | 15,347 | 30,306 | 33,640 | 74,946 |
| Total profit attributable to Group's Shareholders | 8,008 | 15,046 | 30,132 | 33,408 | 74,602 |
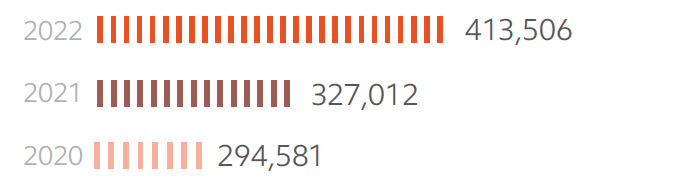
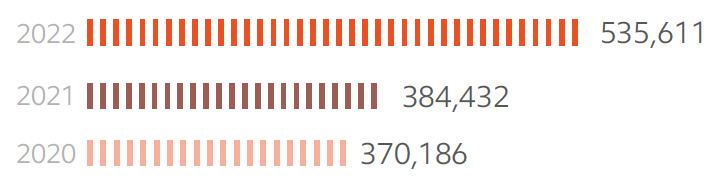
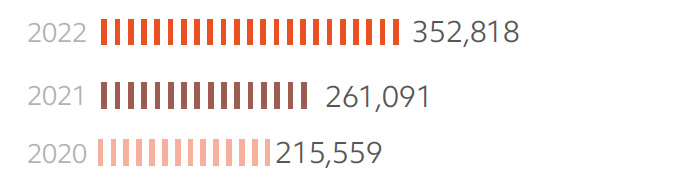
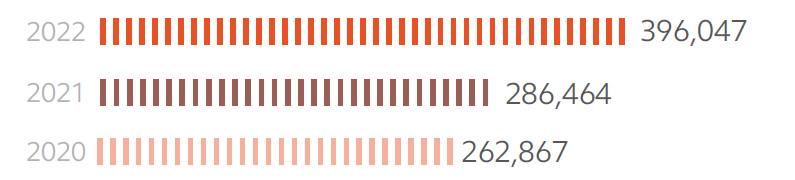
Revenues from sale of products and services
REVENUES FROM SALE OF PRODUCTS AND SERVICES, KZT MILLION13
| Indicator | 2020 actual | 2021 actual | 2022 actual | 2023 forecast | 2024 forecast |
|---|---|---|---|---|---|
| Electricity production | 207,917 | 253,593 | 286,873 | 309,493 | 372,388 |
| Sales of electricity by energy supply companies | 106,911 | 125,685 | 137,578 | 168,405 | 194,924 |
| Heat production | 19,202 | 18,703 | 19,762 | 21,430 | 23,124 |
| Electricity transmission and distribution | 40,685 | 46,428 | 53,654 | 60,552 | 69,029 |
| Sale of chemically purified water | 1,626 | 1,781 | 1,852 | 1,795 | 1,798 |
| Lease | 4,041 | 3,930 | 4,188 | 7,847 | 11,501 |
| Other | 3,181 | 3,702 | 5,574 | 6,435 | 6,724 |
| Intracompany turnover (elimination) | 100,554 | 121,285 | 128,016 | 146,115 | 172,052 |
| Total | 283,010 | 332,537 | 381,465 | 429,842 | 507,436 |
The increase in consolidated revenues is largely due to higher electricity production tariffs and sales volumes. Ekibastuz GRES-1 domestic electricity sales increased by 5% due to an increase in demand and an increase in the selling tariff (including an increase in the pass-through surcharge).
The increase in electricity transmission revenue was driven by a 7% (504 million kWh, from 6.07 KZT/kWh to 6.58 KZT/kWh) increase in electricity transmission volumes of Alatau Zharyk Company. Sales revenue increased by 2% (123 million kWh, from 18.69 KZT/kWh to 20.09 KZT/kWh) due to an increase in electricity sales by AlmatyEnergoSbyt.
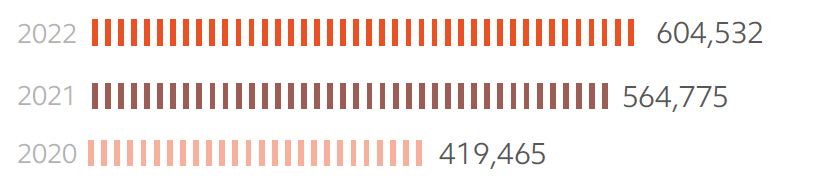
REVENUES FROM CORE OPERATIONS
Electricity production
Electricity transmission and distribution
Electricity sales
Coal mining
Other operations
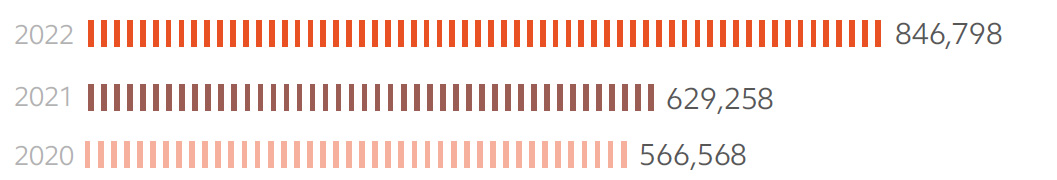
2023-2024 forecast
Due to higher tariffs for electricity production and sale, 2023 revenue is projected at KZT 429,842 million. This is 13% higher than in 2022, which was KZT 48,377 million. In 2024 forecast, the revenue increase results from growth in revenue from electricity generation due to an increase in electricity tariffs, growth in the capacity tariff through centralised bidding and a resulting increase in the electricity sales tariff, growth in sales, transmission and distribution, capacity and growth in electricity transmission tariffs. An increase in electricity tariffs is expected due to the inclusion of the profit margin in the ceiling tariff of Ekibastuz GRES-1, the individual tariff for power generating unit 1 and the first payments under principal loan raised for the project.
REVENUE FROM SALES OF PRODUCTS AND SERVICES BY MANUFACTURERS, KZT MILLION
| Indicator | 2020 actual | 2021 actual | 2022 actual | 2023 forecast | 2024 forecast |
|---|---|---|---|---|---|
| Ekibastuz GRES-1 | 123,478 | 166,366 | 189,266 | 197,180 | 245,621 |
| AlmatyEnergoSbyt | 106,911 | 125,685 | 137,578 | 168,405 | 194,924 |
| Almaty Power Plants | 74,481 | 78,654 | 86,220 | 97,717 | 110,022 |
| Alatau Zharyk Company | 40,819 | 46,594 | 53,842 | 60,769 | 69,249 |
| Moynak HPP | 20,520 | 19,003 | 22,804 | 22,474 | 23,333 |
| Shardarinskaya HPP | 6,761 | 7,183 | 8,680 | 8,038 | 9,655 |
| First Wind Power Plant | 5,031 | 4,881 | 4,987 | 6,935 | 7,785 |
| Bukhtarma HPP | 4,040 | 3,927 | 4,181 | 7,842 | 11,500 |
| Ereymentau Wind Power | - | 4,345 | 5,045 | ||
| Energy Solution Center | 1,287 | 1,128 | 1,515 | 1,736 | 1,817 |
| Samruk-Green Energy | 236 | 399 | 409 | 516 | 538 |
| Intracompany turnover (elimination) | -100,554 | -121,285 | -128,016 | -146,115 | -172,052 |
| Total | 283,010 | 332,537 | 381,465 | 429,842 | 507,436 |
Ekibastuz GRES-1, Almaty Power Plants, Alatau Zharyk Company and AlmatyEnergoSbyt account for the bulk of the Company's core business revenues. When consolidating revenues, intragroup turnover of generation and distribution companies is excluded from the total.
COST OF PRODUCTS SOLD AND SERVICES DELIVERED, KZT MILLION14
| Indicator | 2020 actual | 2021 actual | 2022 actual | 2023 forecast | 2024 forecast |
|---|---|---|---|---|---|
| Cost of electricity production | (156,182) | (183,478) | (202,949) | (242,575) | (276,063) |
| Sales of electricity by energy supply companies | (111,195) | (128,428) | (140,490) | (167,310) | (193,239) |
| Cost of heat production | (18,804) | (19,306) | (22,168) | (22,473) | (24,769) |
| Cost of electricity transmission | (54,365) | (39,358) | (47,040) | (54,609) | (57,910) |
| Cost of sales of chemically purified water | (1,679) | (1,848) | (2,001) | (1,801) | (1,880) |
| Cost of other core businesses | (946) | (767) | (1,140) | (1,436) | (1,501) |
| Depreciation of fixed and intangible assets | (57,331) | (55,168) | (59,764) | (65,132) | (77,127) |
| Intracompany turnover (elimination) | (117,986) | (118,338) | (126,859) | (144,750) | (170,629) |
| Total | (225,185) | (254,847) | (288,929) | (345,454) | (384,733) |
COST OF PRODUCTS AND SERVICES, KZT MILLION
| Indicator | 2020 actual | 2021 actual | 2022 actual | 2023 forecast | 2024 forecast |
|---|---|---|---|---|---|
| Fuel | 59,109 | 60,320 | 68,247 | 68,247 | 89,251 |
| Remuneration and related expenses | 29,394 | 34,120 | 45,643 | 48,650 | 50,901 |
| Cost of purchased electricity | 22,865 | 42,426 | 50,991 | 65,145 | 77,714 |
| Electric capacity maintenance services | 10,094 | 8,718 | 8,819 | 12,435 | 15,069 |
| Depreciation of fixed assets and amortisation of intangible assets | 57,331 | 55,168 | 59,764 | 65,132 | 77,127 |
| Repairs and maintenance | 8,520 | 9,901 | 9,950 | 14,326 | 15,852 |
| Electricity transmission services | 11,494 | 13,239 | 16,847 | 14,180 | 13,873 |
| Materials | 1,713 | 1,930 | 2,181 | 3,592 | 3,802 |
| Water supply | 4,847 | 6,329 | 7,106 | 6,960 | 7,679 |
| Grid losses | 2 | 2 | 2 | 7 | 8 |
| Taxes other than income tax | 4,704 | 4,923 | 4,642 | 7,525 | 8,258 |
| Charges for environmental emissions | 4,616 | 7,802 | 7,664 | 10,518 | 10,961 |
| Third-party services | 6,003 | 5,649 | 3,385 | 9,531 | 9,499 |
| Other | 4,492 | 4,320 | 3,688 | 4,561 | 4,739 |
| Total | 225,185 | 254,847 | 288,929 | 345,454 | 384,733 |
At the end of 2022, the cost of production was KZT 288,929 million, 13% higher than in 2021. The increase in costs is due to increased costs of purchased electricity from the Financial Settlement Centre of Renewable Energy (increased purchase volumes), payroll, coal (increased cost of coal including transportation) and depreciation costs. There has also been an increase in other costs due to rising prices of goods and services.
In 2022, depreciation was KZT 59,764 million. This is 8% (or KZT 4,596 million) higher than in 2021. The increase is due to the rescheduling of operating equipment at Almaty Power Plants (boiler units, turbine units, ash dumps) in connection with the transition to gas of CHPP-2 in 2027 and CHPP-3 in 2025.
COST STRUCTURE BY MAIN TYPES OF BUSINESS, %
| Indicator | 2021 | 2022 |
|---|---|---|
| Fuel, oil and lubricants, energy | 44 | 44 |
| Raw materials, other work, services and rent of production nature | 4 | 4 |
| Services related to transmission and sale | 6 | 6 |
| Depreciation of fixed assets and amortisation of intangible assets | 22 | 21 |
| Taxes and other compulsory payments to the budget | 6 | 6 |
| Production staff payroll | 11 | 13 |
| Repairs | 4 | 3 |
| Other | 2 | 2 |
2023-2024 forecast
According to the projections, the increase in the cost of production will be due to higher prices for goods and services, as well as an increase in production.
PROFIT AND EXPENSES, KZT MILLION
| Indicator | 2020 actual | 2021 actual | 2022 actual | 2023 forecast | 2024 forecast |
|---|---|---|---|---|---|
| Gross profit | 57,826 | 77,690 | 92,536 | 84,387 | 122,703 |
| Operating profit | 31,798 | 53,868 | 64,574 | 57,501 | 96,994 |
| Earnings before interest, taxes, depreciation, and amortization (EBITDA) | 99,728 | 123,447 | 141,382 | 135,925 | 202,303 |
| Profit (loss) before tax | 13,739 | 24,055 | 47,153 | 45,799 | 92,076 |
| Total profit (loss) before minority interest | 8,083 | 15,347 | 30,306 | 33,640 | 74,946 |
| Total profit attributable to Group's Shareholders | 8,008 | 15,046 | 30,132 | 33,408 | 74,602 |
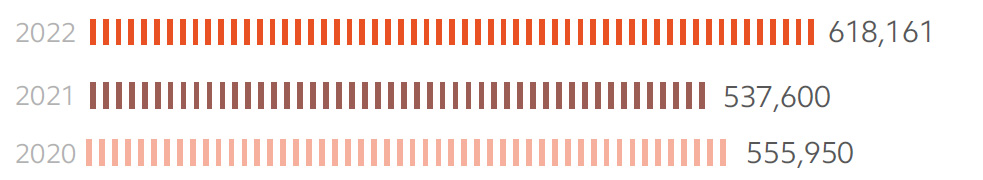
In 2022, profit from equity companies amounted to KZT 16,103 million, an increase of 20%, or KZT 2,648 million, year on year.
SHARE IN PROFITS OF JOINT VENTURES AND ASSOCIATES, KZT MILLION
| 2020 actual | 2021 actual | 2022 actual | 2023 forecast | 2024 forecast |
|---|---|---|---|---|
| 9,474 | 13,455 | 16,103 | 12,324 | 27,437 |
Changes in assets
Forum Muider (50%) increased its FM profit by KZT 3,029 million year on year. This sum includes KZT 1,260.2 million increase in foreign exchange gain and KZT 1,027.0 million increase in operating profit due to a decrease in administrative expenses (in 2021, KZT 1,369.6 million claim on Arman Kala) and sales expenses resulting from the reduction in tariff for railway siding services.
2023-2024 forecast
The increase in profit of equity companies is planned due to the increase in Ekibastuz GRES-2 profits, capitalisation of finance expenses, and other expenses in connection with the resumption of the project for power generating unit 3, as well as an increase in the tariff for electricity production and capacity.
Sales costs
At the end of 2022, sales costs increased by 1%, or KZT 81 million, against 2021 to reach KZT 9,110 million. This deviation is due to higher prices for KEGOC services.
2023-2024 forecast
In the forecast for 2023, sales expenses are planned at KZT 9,047 million. This is 1% less than in 2022 (KZT 63 million) due to the exclusion of export volumes. In the forecast for 2024, the increase in sales costs is due to an increase in busbar output.
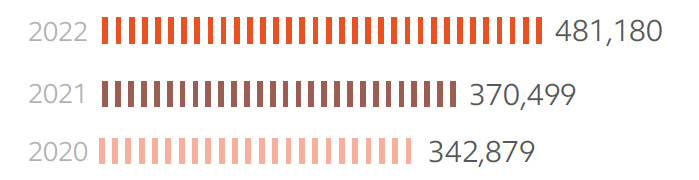
Administrative expenses
In 2022, administrative expenses amounted to KZT 18,852 million, an increase of 27%, or KZT 4,059 million, year on year in 2021. It results from increased expenses of Ekibastuz GRES-1 because of a penalty on corporate income tax (CIT) related to the cancellation of tax preference on 500 kV switchyard, with deduction of interest expenses and CIT accrual, and penalty on headquarters as per state audit order dated 23 September 2022.
ADMINISTRATIVE EXPENSES, KZT MILLION
| 2020 actual | 2021 actual | 2022 actual | 2023 forecast | 2024 forecast |
|---|---|---|---|---|
| 15,826 | 14,793 | 18,852 | 17,839 | 15,922 |
2023-2024 forecast
In the forecast for 2023, administrative costs are lower than in 2022 and amount to KZT 17,839 million. The 2024 forecast includes a reduction in administrative costs through Qazaq Green Power's IPO.
Financial expenses
In 2022, the Company's financial expenses amounted to KZT 29,748 million, which is KZT 391 million lower than the actual amount in 2021. The main decrease is due to the early repayment of two tranches of the ADB loan to headquarters and the partial early repayment of the loan to EBRD.
FINANCIAL EXPENSES, KZT MILLION
| 2020 actual | 2021 actual | 2022 actual | 2023 forecast | 2024 forecast |
|---|---|---|---|---|
| 31,025 | 30,139 | 29,748 | 27,208 | 34,948 |
2023-2024 forecast
In the 2023 forecast, financing costs amount to KZT 27,208 million, driven by plans for early repayment of the ADB loan, as well as lower costs for Ekibastuz GRES-1. The increase in the forecast for 2024 is due to an increase in interest costs in operating expenses resulting from the commissioning of power generating unit 1 of Ekibastuz GRES-1.
Liquidity and financial stability indicators
COMPLIANCE WITH COVENANTS FROM EXTERNAL LENDERS
| Covenant | Standard | 2020 (actual) | 2021 (actual) | 2022 (actual) | Note |
|---|---|---|---|---|---|
| Debt/EBITDA (EBRD, ADB) | no more than 3.5 | 2.96 | 2.70 | 2.14 | compliant |
| EBITDA/interest (EBRD, ADB) | no less than 3.0 | 3.76 | 5.00 | 5.92 | compliant |
| Debt/Equity (KDB) | not more than 2.0 | 0.54 | 0.59 | 0.50 | compliant |
At the end of 2022, the Company has complied with all financial and non-financial covenants of the lenders, which are fixed on a semi-annual basis.
Loan covenants
The Group has certain covenants on all bank loans and liabilities, bonds, bank guarantees of Samruk-Energy and the loan of Samruk-Energy from Samruk-Kazyna. Non-compliance with these covenants could lead to negative consequences for the Group, including higher borrowing costs and default. In 2022, the Company met all regulatory loan covenants. It also received waivers to reduce thresholds in cases where a breach event was foreseeable.
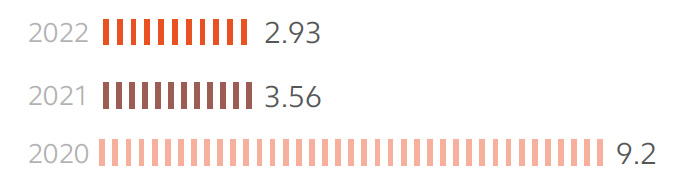
Debt burden
In 2022, the consolidated nominal debt of the Company was KZT 314.6 billion, a decrease of KZT 35.3 billion. The decrease in nominal debt during the reporting period was due to the partial early repayment of the EBRD loan to headquarters and the full early repayment of two tranches of the ADB loan.
Currency and inflation risks
To mitigate inflation risks, the Company made an early repayment of the EBRD loan to Shardarinskaya HPP through the issue of the Company's first green bonds on the AIX platform. Also, to reduce interest payments, there was a partial early repayment of the EBRD loan to headquarters in the amount of KZT 8 billion and a full early repayment of two tranches of the ADB loan in the amount of KZT 30.6 billion.
Optimisation of interest expenses
Interest expenses were reduced owing to scheduled (KZT 56.6 billion) and early repayments of debt (KZT 76.8 billion), performance of works aimed at reducing interest rates by changing the financing terms and refinancing existing loans of Samruk-Energy from new alternative funding sources.
Credit rating (Fitch Ratings)
On 7 November 2022, Fitch Ratings upgraded the long-term foreign and local currency credit ratings of Samruk- Energy to ''BB+'' and upgraded the standalone creditworthiness of Samruk- Energy from ''b+'' to ''bb-'' and the unsecured credit rating from ''BB'' to ''BB+''. The outlook is "Stable".
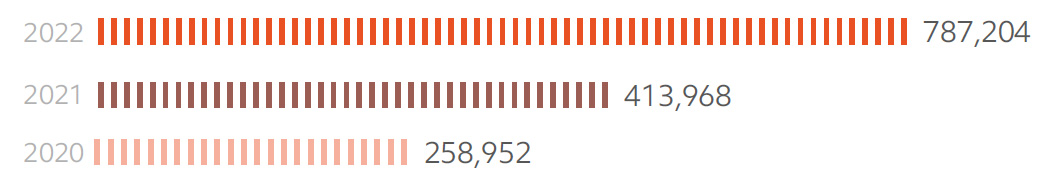
Capital liabilities
The Company has analysed its exposure to seasonal and other emerging business risks and has not identified any risks that could affect the Group's financial performance or position as of 31 December 2022. The Group has the necessary funds and sources of financing to meet its capital liabilities and to ensure working capital.
As of 31 December 2022, the Company had contractual liabilities to purchase fixed assets for a total amount of KZT 65,331 million. As of 31 December 2021, the amount was KZT 84,376 million.
Comparative analysis (benchmarking)
Benchmarking, or comparing operational and financial indicators with foreign peer companies to identify weaknesses and strengths, is an essential element of Samruk-Energy management.
Samruk-Energy applies the following indicators for benchmarking purposes:
- EBITDA margin;
- Debt/EBITDA;
- leverage ratio (debt/equity);
- return on invested capital (ROIC).
Benchmarking results
According to benchmarking results (data from the following peer companies were used: Mosenergo, Russia; CEZ Group, Czech Republic; Drax Group, Great Britain) Samruk-Energy is inferior to foreign peers in some respects. Financial sustainability indicators show that the Company is making full use of available financial leverage. Samruk-Energy outperforms its peers in terms of EBITDA margin and Debt/EBITDA. This indicates a high return on sales. However, ROIC (return on long-term invested capital) is below its European peers.
EBITDA MARGIN 2022, %
| Company | Indicator |
|---|---|
| Samruk-Energy | 37.1 |
| RusHydro | 11.1 |
| E.ON | 7.0 |
| Drax Group | 9.4 |
RETURN ON LONG-TERM INVESTED CAPITAL (ROIC) 2022, %
| Company | Indicator |
|---|---|
| Samruk-Energy | 5.0 |
| RusHydro | 7.6 |
| E.ON | 13.0 |
| Drax Group | 7.1 |
It is worth noting that, unlike its public peers, Samruk-Energy is owned by the Government of Kazakhstan, and is a promoter of state policy in the electricity sector. This factor, as well as a high degree of depreciation of the energy sector, had a significant impact on the growth of investment in the Company's assets. Since 2009, socially important investment projects aimed at ensuring the reliability and uninterrupted operation of the Kazakh power system have been implemented. This has led to a reduced return on investment.
| Criterion | Unit | Status | Mix ---- Benchmarking ----Max |
|---|---|---|---|
| EBITDA margin | % | 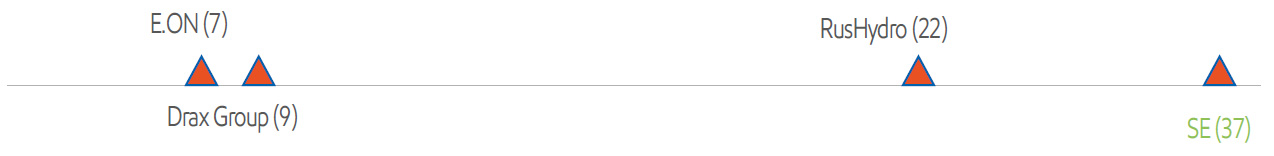 |
|
| Debt\ EBITDA | Ratio | 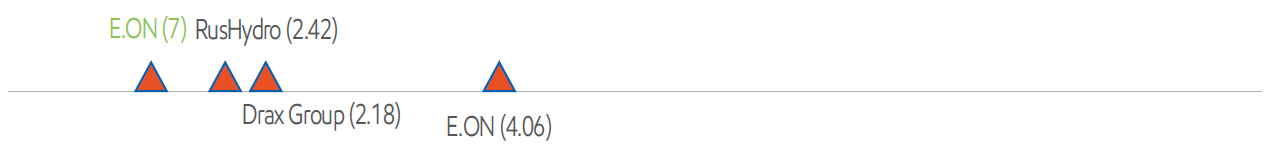 |
|
| Debt\Equity | Ratio | 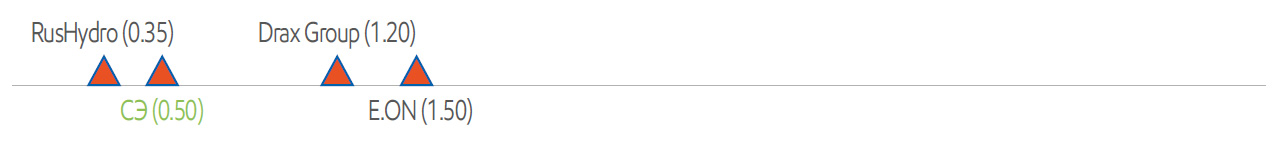 |
|
| ROIC | % | 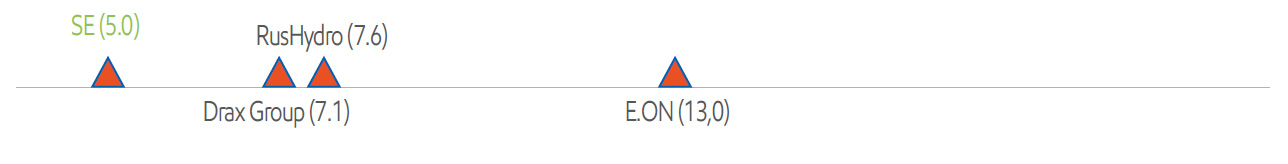 |
Another factor affecting return on investment is the low electricity tariff in Kazakhstan compared to peer companies.
DIFFERENCE IN ELECTRICITY TARIFFS IN PEER COUNTRIES
| Country | Average kWh tariff | KZT/kWh | Average rate in 2022 |
|---|---|---|---|
| Kazakhstan | KZT 20.45 | 20.42 KZT/kWh | |
| Russia | RUB 4.44 | 30.73 KZT/kWh | 6.92 KZT/RUB |
| Germany | EUR 0.19 | 92.15 KZT/kWh | 485.28 KZT/EUR |
| Great Britain | GBP 0.30 | 170.92 KZT/kWh | 569.73 KZT/GBP |
enterprises
Establishing and developing a sustainable procurement system is one of our most important and high-priority tasks. We are constantly improving our documents, introducing innovations, automating the procurement process, and training our personnel.
The Company's procurement activities are based on the principles of:
- Optimal and efficient use of funds
- Openness and transparency with respect to suppliers' rights and/or legitimate interests to commercial confidentiality (prior to tender results)
- Fair competition and avoidance of collusion between bidders
- Accountability of procurement participants
- Corrupt practices prevention
- Support of domestic producers of goods, works and services, if this is not contrary to international treaties ratified by Kazakhstan
- Procurement of innovative and high-tech goods, works and services
- Equal opportunities for suppliers to participate in procurement procedures, except in cases provided for by the Law
- Observance of intellectual property rights
Documents governing the Company's procurement activities:
1. The procurement procedure for Samruk-Kazyna and organisations, fifty and more percent of voting shares (participatory interest) of which are directly or indirectly owned by Samruk-Kazyna on the right of ownership or trust management17. The document defines the main approaches to procurement activities and methods of procurement.
2. Law of the Republic of Kazakhstan On Procurement of Certain Entities of the Quasi-Public Sector (hereinafter referred to as the Law)18
Improved procurement procedures are carried out by the Contracting Authority. Relations with suppliers and potential suppliers are established in accordance with the Law and the Procedure. Once a contract has been signed, relations are governed by the civil legislation and the contract. All quality requirements for goods, works and services are established by the technical specification and the contract. Contracts always provide for local content reporting, penalties and other reports.
Goods, works and services are supplied to the Company in accordance with the internal regulatory documents of subsidiaries and affiliates, with each subsidiary and affiliate developing its own procedure for supplying goods, works and services.
To ensure and improve transparency and effectiveness, all procurement procedures of the Company are carried out on the E-procurement Portal www.zakup.sk.kz , which is designed for procurement procedures, collection of reports, evaluation and qualification of suppliers.
Category management
GRI 2-6
The procurement category management process provides for optimisation of procurement activities. The concept of procurement category management is based on the total cost of ownership — reducing the costs of goods, works and services category over its entire lifecycle, rather than just the direct procurement costs, which allows selecting the most modern and cost-effective solutions. The changes introduced in procurement activities have a positive impact on procurement prices and the quality of purchased goods, as well as contribute to the development of domestic producers.
For example, as part of the procurement strategy for the Industrial Chemicals category, the Company purchases a Russian-made inhibitor of mineral salt deposition (IOMS-1). Domestically produced IOMS-1 was purchased in 2022, resulting in a lower purchase price. The updated version of the Strategy establishes TPF as the priority when announcing the procurement of IOMS-1.
The actual economic effect of KZT 5.2 billion was achieved during implementation of procurement category strategies.
GRI 204-1, GRI 12: Coal Sector: 12.8.6
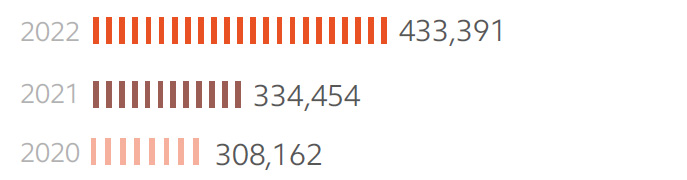
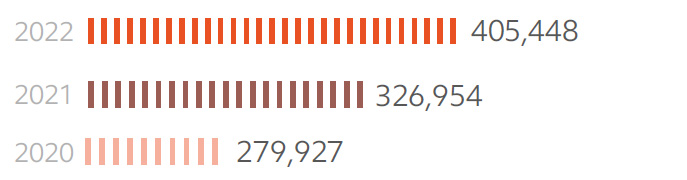
TOTAL PURCHASES, KZT BILLION
| Indicator | 2020 | 2021 | 2022 | |||
|---|---|---|---|---|---|---|
| total | % of local suppliers | total | % of local suppliers | total | % of local suppliers | |
| Goods | 143.67 | 99.23 | 185.30 | 99.45 | 173.34 | 98.50 |
| Works and services | 100.83 | 98.68 | 155.87 | 99.96 | 123.1 | 99.83 |
| Total | 244.50 | 99 | 341.17 | 99.18 | 296.44 | 98.17 |
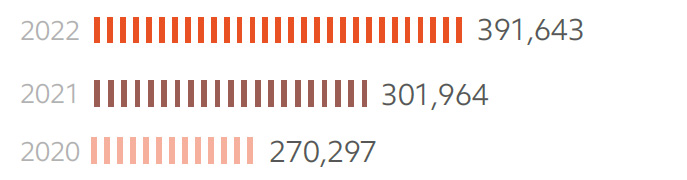
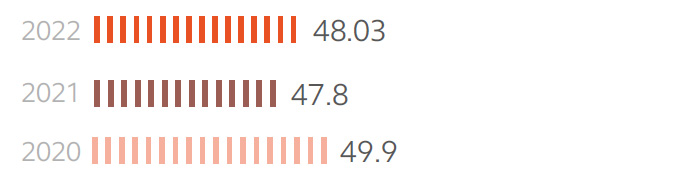
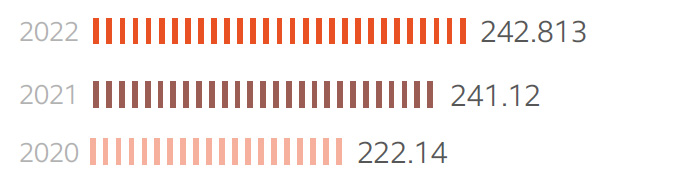
LOCAL CONTENT SHARE20, IN DELIVERED GOODS/WORKS/SERVICES, KZT BILLION
| Indicator | 2020 | 2021 | 2022 | |||
|---|---|---|---|---|---|---|
| total | % of local content share | total | % of local content share | total | % of local content share | |
| Goods | 168.78 | 79 | 187.63 | 89 | 174.89 | 78.42 |
| Works and services | 104.66 | 79 | 144.45 | 93 | 127.06 | 93 |
| Total | 273.44 | 79 | 332.08 | 91 | 301.95 | 85 |